

The Exploratory Data Analysis (EDA) phase is critical in understanding the characteristics of the datasets we are using, identifying patterns, detecting anomalies, and gaining insights that will guide subsequent steps in the AI face detection project. By performing EDA, we can ensure the quality and relevance of our data, which in turn enhances the performance of our machine learning models.
Objective Of EDA
- Data Distribution:
- Analyze the distribution of image features such as pixel intensity values, color channels, and dimensions.
- Understand the balance of classes (real vs. AI-generated faces) to ensure fair training.
2. Summary Statistics:
- Calculate summary statistics including mean, median, standard deviation, and range for key image features.
- Evaluate the overall diversity of the dataset in terms of age, ethnicity, and gender if such metadata is available.
3. Visualization:
- Visualize the data using histograms, box plots, and scatter plots to identify trends and outliers.
- Use image montage or grid displays to visually inspect a subset of images from both datasets.
4. Correlation Analysis:
- Compute correlations between different features to identify any multicollinearity or redundant information.
- Use heatmaps to visualize the correlation matrix.
Data Distrubution Analysis
Understanding the distribution of pixel intensities and color channels helps in normalizing and preprocessing the data
- VISUALIZE SAMPLE IMAGES
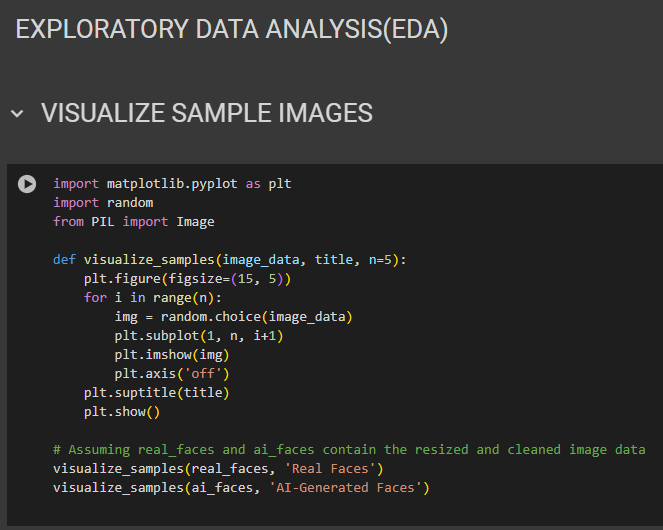
Output:
ANALYZE IMAGE SIZE AND ASPECT RATIO
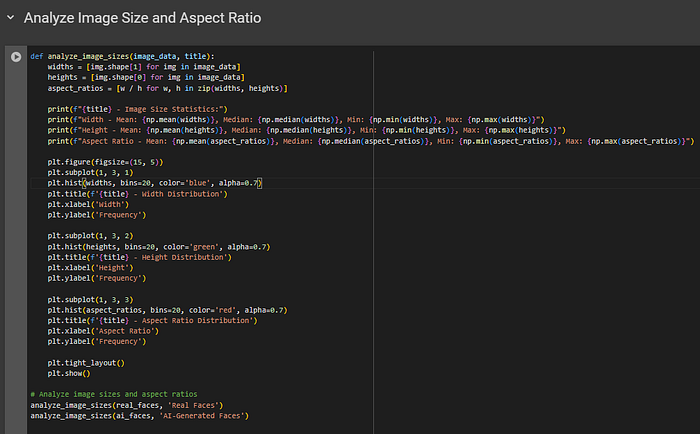
Output:
Real Faces — Image Size Statistics:
Width — Mean: 128.0, Median: 128.0, Min: 128, Max: 128
Height — Mean: 128.0, Median: 128.0, Min: 128, Max: 128
Aspect Ratio — Mean: 1.0, Median: 1.0, Min: 1.0, Max: 1.0
AI-Generated Faces — Image Size Statistics:
Width — Mean: 128.0, Median: 128.0, Min: 128, Max: 128
Height — Mean: 128.0, Median: 128.0, Min: 128, Max: 128
Aspect Ratio — Mean: 1.0, Median: 1.0, Min: 1.0, Max: 1.0
IMAGE PREPROCESSING TECHNIQUES
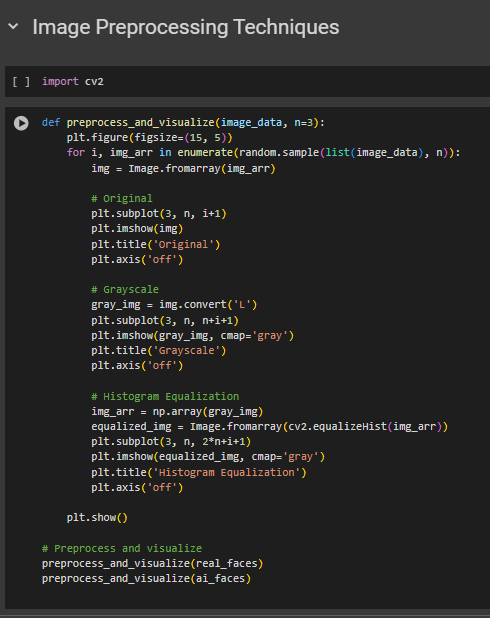
output:
Feature Extraction

Output:
CLASS BALANCE ANALYSIS
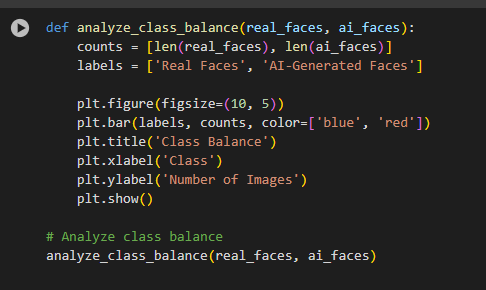
Output:
Correlation Analysis
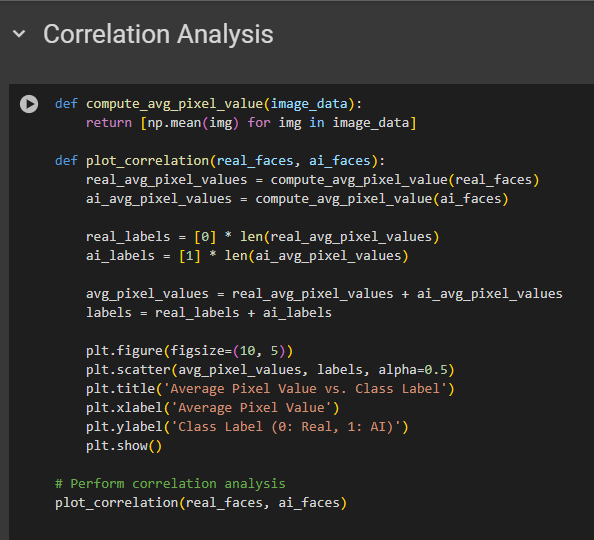
output:
Outlier Detection
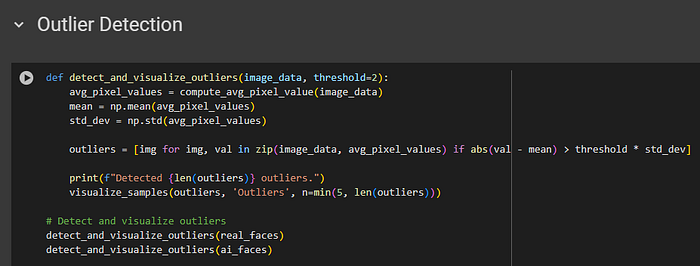
Output:
Detected 396 outliers
Detected 369 outliers.
👉The Next Step
Read the previous episode-4 or keep an eye out for the next episode-6, where we’ll dive into feature engineering to extract meaningful patterns from our data and enhance the performance of our AI face detection model. Stay tuned for more exciting developments!.
Related articles

Real versus AI
In recent years, the rapid advancement of artificial intelligence (AI) has led to the creation of highly realistic AI-generated faces. These synthetic images, often produced by generative …
Lets us help you bring your dream to life!
We are here to understand your needs and provide solutions across various areas of technology and business. Join us on this transformative journey as we transform the future into a tangible reality.